
SQL I Data Reporting and Analysis Course I Certification I Training

Brainmeasures SQL Data Reporting and Analysis Course and Training
What you will learn?
If you're a data-driven professional who works with SQL on a regular basis, you know how important it is to create effective reports and dashboards that convey your data insights in a clear, concise way. But with so many different tools and techniques available, it can be tough to know where to start. That's why we've put together this guide to help you streamline your SQL reporting process and create insightful, visually appealing reports that communicate your insights effectively.
Configure the SQL Query Environment
Using the SELECT Statement, get data
Get Rid of Duplicate Records
Record Returns by Sort
Data analysis with subqueries
using layered subqueries to analyze data
Data filtering with the WHERE Clause
Filter data with different operators.
a summary of the data
Analyse information from various tables.
Brainmeasures SQL Data Reporting and Analysis course is a perfect course to learn this skill and excel professionally.
Understanding the Basics of Database Structuring
Database structuring is a crucial process in modern businesses. This process entails the arrangement of data into a database model, such as a relational database. Through database structuring, different data elements can be merged from various tables, making it possible for businesses to have easy access to the information they need to make informed decisions. With a well-structured database, organizations can easily manipulate data, run analytics, and generate reports that enable them to gain valuable insights into their operations. The process of database structuring is pivotal in ensuring that businesses can make better decisions through the efficient handling of large amounts of data. In conclusion, having a proper system for organizing data is essential for businesses that want to stay ahead of the curve in our data-driven world.
However, structuring a database is only the first step in effectively managing data. Once the database is set up, businesses will need to report and analyze this data to make informed decisions. This is where SQL comes in. SQL, or Structured Query Language, is a powerful tool for retrieving and manipulating data within a database. By learning SQL, businesses can create customized reports and analyses to gain insights into their data and make informed decisions. Ultimately, the combination of a well-structured database and an understanding of SQL will lead to more efficient and effective management of data, which is crucial in today's data-driven business world.
Developing an Effective Report Design Structure
When curating a video course on how to code in SQL, it must provide the necessary information or data related to the topic. It is important to present the information in a concise and organized manner, making use of tables or charts where appropriate to help illustrate the information. The first step is to clearly define what SQL is and what it is used for in the context of coding. This can be followed by an overview of the basic syntax and structure of SQL commands. The body of the report should also include examples of different SQL statements and how they are used in practice. Additionally, it is important to cover best practices for SQL coding, such as proper formatting and commenting techniques. By presenting this information in an easy-to-understand format, enrolled candidates will be able to gain a solid understanding of how to code in SQL.
Additionally, a well-crafted curated course should not only provide the necessary information to educate on a particular topic but also summarize the key points effectively. For instance, when discussing what is SQL, it should summarize the fundamental concepts of Structured Query Language and how it works. This way, learners can easily comprehend the main message of the course and better understand the subject matter.
Who should enroll in this course?
Novice data scientist analyst
Beginner Data Engineer Beginning Data Analyst
Data Reporting Analyst at the Beginning
Expected Salary
According to Payscale, in the US, newly-qualified data analysts (i.e. those with less than a year of experience) earn an average annual income of $56,590.
Demand for SQL data analysts and reporters is growing exponentially, enroll today and grow professionally.
By focusing on organizing your data, using the right visuals, and presenting your insights in a way that resonates with your stakeholders, you'll be able to create reports that are both informative and visually appealing. With the help of this course, you'll be able to streamline your reporting process and present your insights in a way that drives action and positively impacts your organization. So, what are you waiting for? Start learning today and see the difference they can make!
| Getting Started | 11 lectures | 17 mins |
| HTML and foundation | 11 lectures | 17 mins |
| Some title goes here | Preview | 01:42 |
| Welcome guide document | 10 Pages | |
| Some title goes here | 07:42 | |
| 2 Some title goes here | 07:42 | |
| Hello Some title goes here | 07:42 | |
| This is Some title goes here | 07:42 |
| CSS and foundation | 17 lectures | 87 mins |
| Some title goes here | Preview | 01:42 |
| Welcome guide document | 10 Pages | |
| Some title goes here | 07:42 | |
| 2 Some title goes here | 07:42 | |
| Hello Some title goes here | 07:42 | |
| This is Some title goes here | 07:42 |
| Making Responsive Website | 17 lectures | 87 mins |
| Some title goes here | Preview | 01:42 |
| Welcome guide document | 10 Pages | |
| Some title goes here | 07:42 | |
| 2 Some title goes here | 07:42 | |
| Hello Some title goes here | 07:42 | |
| This is Some title goes here | 07:42 |
| Learn Sass less Scss | 17 lectures | 87 mins |
| Some title goes here | Preview | 01:42 |
| Welcome guide document | 10 Pages | |
| Some title goes here | 07:42 | |
| 2 Some title goes here | 07:42 | |
| Hello Some title goes here | 07:42 | |
| This is Some title goes here | 07:42 |
| Learn about Cpanel and file uploads | 17 lectures | 87 mins |
| Some title goes here | Preview | 01:42 |
| Welcome guide document | 10 Pages | |
| Some title goes here | 07:42 | |
| 2 Some title goes here | 07:42 | |
| Hello Some title goes here | 07:42 | |
| This is Some title goes here | 07:42 |
Enroll in this course now and avail all the benefits.

Learn One-to-One Live Course - Coming Soon.


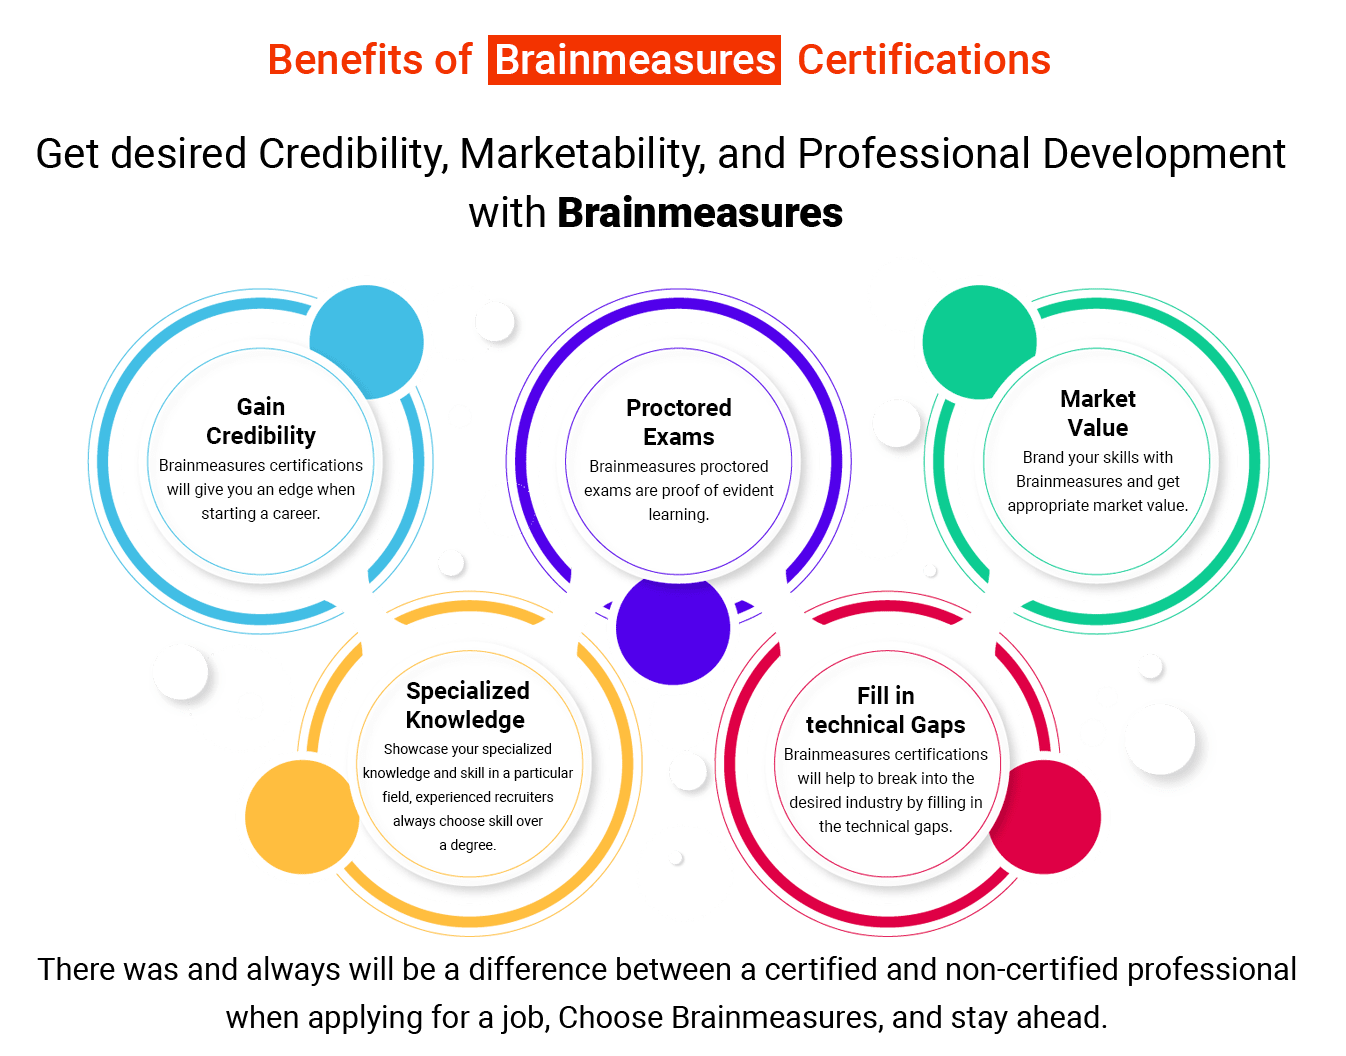
Brainmeasures certified Professionals work with global leaders.


The video online course is well-structured and comprehensive.
The topics are organized in proper sequence to enable the candidate understand them easily.
Easy to understand and implement in real life.
Sufficient pictures, tables, graphs have been provided to make this online Course more attractive to the readers.
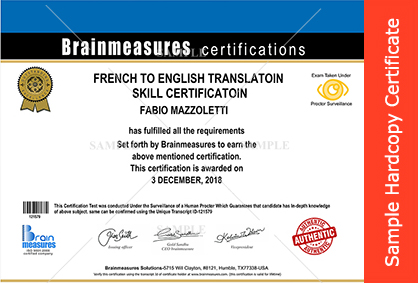
Final certification exam conducted under surveillance of trained human proctor.
We will ship your hard copy anywhere you ask for.


587960 Enrolled 01:05 Total Hours
$39
925342 Enrolled 00:56 Total Hours
$39
196323 Enrolled 06:19 Total Hours
$39
971025 Enrolled 01:07 Total Hours
$39
Take free practice test now
In today’s corporate world, a single wrong decision can cost you millions; so you cannot afford to ignore any indemnities you may incur from a single wrong hiring decision. Hiring mistakes include the cost of termination, replacement, time and productivity loss while new employees settle into their new job.
Our Mission is simply to help you attain Course Name knowledge which is at par with best, we want to help you understand Course Name tools so that you can use them when you have to carry a Course Name project and make Course Name simple and learnable.

Every month, more than 1,000 companies approach us to hire new employees, and we create customised tests (MCQs, Subjective type, one word, coding questions, Hackathon) for their drive. This proves employers' trust in our skill testing services, so having a Brainmeasures skill certificate on your resume will provide the edge you need.
We have followed up with every candidate of Brainmeasures who has taken a Brainmeasures Certificate for promotion or job and 97.78% confirmed that Brainmeasures Certificate helped them land their dream job.
Having a Brainmeasures certificate gives you an added advantage, skill is the biggest asset recruiters are looking for and what better way to prove that you are skilled than having a Brainmeasures certificate on your resume.
Brainmeasures exams are proctored which means candidates are monitored during the exam and this system has been designed to avoid any stance of cheating, while the candidate takes the test his video is recorded and the same can be provided to the employer or hiring manager if required and the certificate can be verified on-site using transcript number given on certificate.
Brainmeasures tests are developed by professionals with years of working experience which means only candidates with real skills pass the exam.
HR and Hiring Managers of leading organizations across the globe choose Brainmeasures certified professionals as we have proved in the last 13 years that when it comes to skill-testing no one does it better than Brainmeasures.
Brainmeasures.
Global leader in online certification and employment testing
info@brainmeasures.com Enquiry@brainmeasures.com