
Excel formulas l functions Video Course I Certification l Training

What will you learn from this course?
Learn to Think like Excel and create strong and dynamic Excel formulae from the ground up.
Excel can automate, streamline, and entirely transform your workflow.
Learn exclusive strategies and tactics that you will not discover in any other training, guaranteed.
Discover engaging, dynamic, and extremely effective demonstrations from a best-selling Excel instructor.
Create, manage, and filter tables with ease to answer crucial questions about your data.
Learn the IF, HLOOKUP, VLOOKUP, and other useful functions.
Use Sum, Count, Average, Max, and Min to easily aggregate data in Tables.
Use Conditional Formatting to highlight data based on a variety of conditions.
Learn how to use Spreadsheet Data Bars, Color Scales, and Icons.
To simply calculate filtered data, use the SUMIF, COUNTIF, and AVERAGEIF functions.
Date formulae can be used to determine time and date intelligence.
Text formulas can be used to alter text entries.
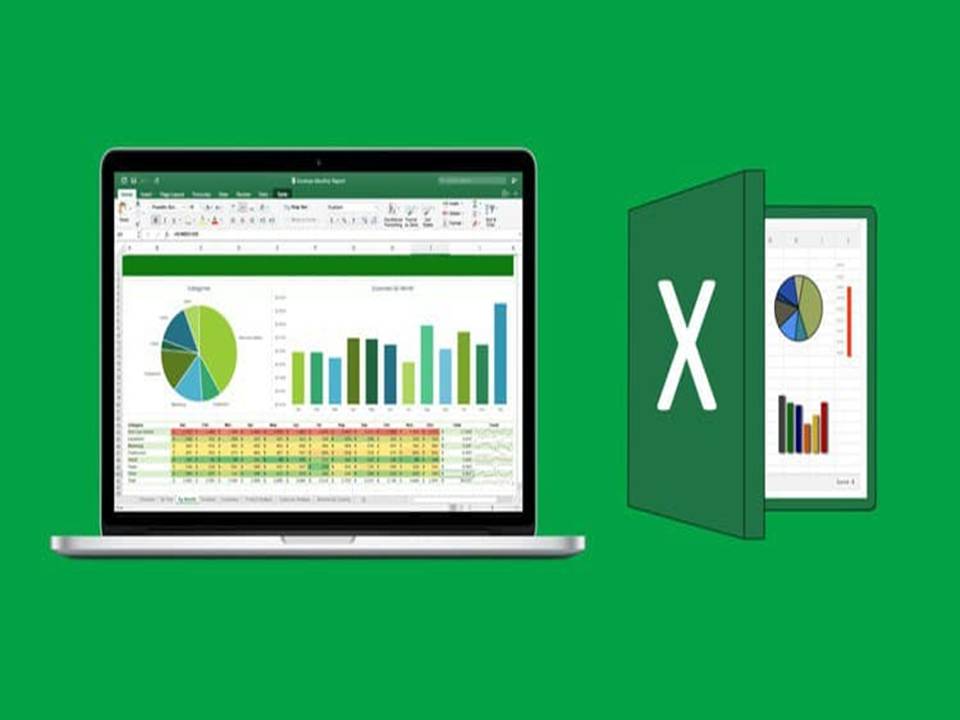
What is Microsoft Excel?
Excel is a Microsoft software program that uses spreadsheets to organize numbers and data using formulae and functions. Excel analysis is used by businesses of all kinds to undertake financial analysis all across the world.
Microsoft Excel is a spreadsheet program developed by Microsoft that is available for Windows, macOS, Android, and iOS. It includes calculating or computation skills, graphing tools, pivot tables, and Visual Basic for Applications, a macro programming language. Excel is part of the Microsoft Office software suite.
Excel is commonly used for data organization and financial analysis. It is utilized in all business functions and in all sizes of businesses.
Excel's primary applications include
Entering data
Data administration
Accounting
Financial evaluation
Graphing and charting
Programming
Time administration
Task administration
Financial simulation
Customer service management (CRM)
Almost everything requires organization!
What are basic operations on excel?
Microsoft Excel contains the fundamental features of all spreadsheets, using a grid of cells organized in numbered rows and letter-named columns to manage data manipulations such as arithmetic operations. It comes with a slew of built-in functionalities to address statistical, engineering, and financial requirements. Furthermore, it may display data in the form of line graphs, histograms, and charts, as well as a very restricted three-dimensional graphical presentation. It enables data sectioning to evaluate its dependency on numerous elements from several perspectives (through pivot tables and the scenario manager). A Pivot Table is a data analysis tool.
This is accomplished by using PivotTable fields to simplify big data sets. It has a programming component, Visual Basic for Applications, which allows the user to apply a wide range of numerical methods, such as solving differential equations in mathematical physics and then sending the results back to the spreadsheet. It also has a variety of interactive features that allow user interfaces that can completely hide the spreadsheet from the user, so the spreadsheet presents itself as an application, or decision support system (DSS), via a custom-designed user interface, such as a stock analyzer, or in general, as a design tool that asks the user questions and provides answers and reports.
In a more complex implementation, an Excel application can poll external databases and measuring instruments on a regular basis using an updated schedule, analyze the results, create a Word report or PowerPoint slide show, and e-mail these presentations to a list of participants on a regular basis. Excel was not intended to be a database.
What are the benefits of Excel?
Prepare your data
Microsoft Office Excel, which is designed to provide in-depth insight into all of your data, allows you to lay out your text data in a spreadsheet or workbook style. Excel spreadsheets and workbooks can be used to consolidate information and data from multiple files and sites into a single destination, where it can be crunched and analyzed on a single file.
Data is simple to convert and rearrange
Format your spreadsheets effortlessly by utilizing multiple color tones, bold, and italics to highlight the most critical facts. Extremely handy when showing a slew of numbers all related to the same issue, such as accounting data such as pre-tax profit and balance carried forward by the corporation. Furthermore, MS Excel allows users to choose an appropriate color scheme for easy analysis.
Recognize and analyze trends and patterns in massive volumes of data
Microsoft Excel makes it simple to detect and analyze trends in data sets with up to one million rows and 16,000 columns.
Formatting with Conditions
Conditional formatting in MS Excel allows you to change the formatting of a cell based on the information contained within it. For example, you may have numerals less than a thousand in red and numbers greater than a thousand in blue.
Connectivity and sharing
Through Share Point or One Drive, MS Excel allows you to share and collaborate with other members of your project or friends group. It is as simple as sharing the link to the same file with everyone.
Who can take this course?
Excel users who wish to learn how to create sophisticated formulas from scratch should take a look at this course.
Anyone looking to broaden their analytics skill set, operate more efficiently with data and advance their career.
Students seeking Excel analytics training that is engaging, hands-on, and highly interactive
Excel users who want to improve their analytical thinking and business intelligence skills
Anyone interested in a career in analytics, data science, or business intelligence should read this.
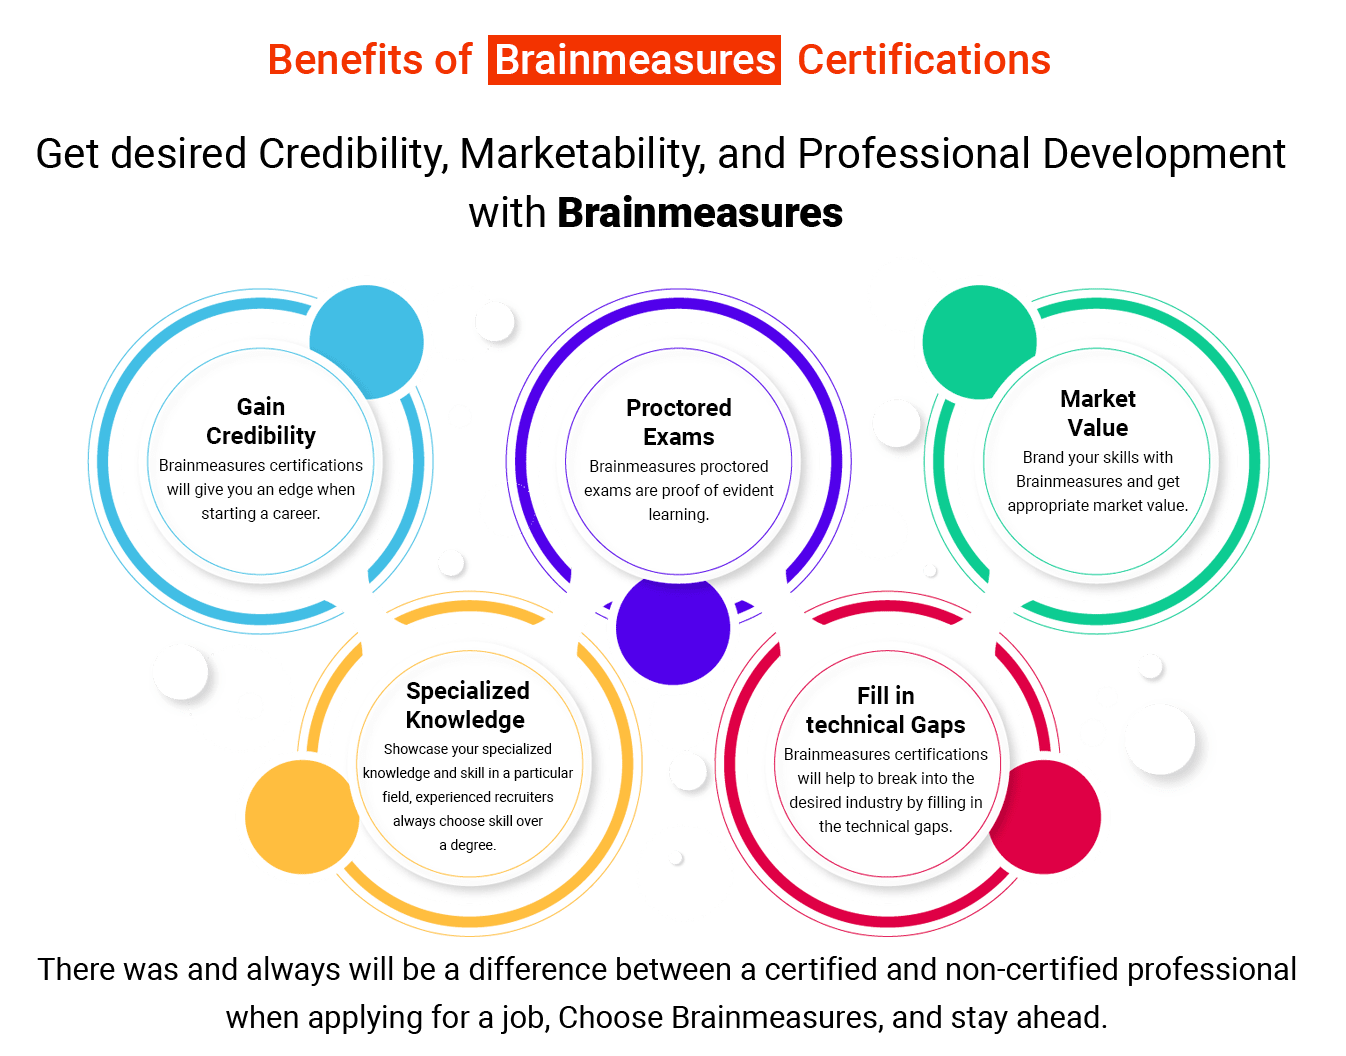
Why Brainmeasures?
Brainmeasures is an ISO-certified company that offers you high-end certification courses and many other services to boost your career. We hire experienced and qualified experts to create in-depth and prominent content courses to train our learners whether they are amateurs or have some experience in the field. We provide the best courses to offer you top-notch skills with a broad scope.
All of the services provided by Brainmeasures are offered at a very minimal and reasonable price. We also provide considerable discounts on various skills and courses to make them affordable for everyone.
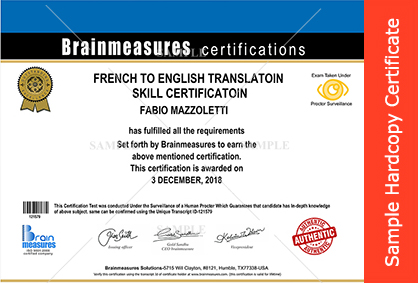
At Brainmeasures, you will be provided with high-end courses after which you can get a hard copy certificate. You only have to clear a test and you will get a certificate that assures you a bright future by securing your job. You will be hired by great companies in no time.
There are also many other facilities and features provided by Brainmeasures. To check these services, click on the following links:
1300 PDF Courses (Technical and Non-Technical)
20000+ Video Courses (Technical and Non-Technical)
Reviews (If you like our services let others know)
| Getting Started | 11 lectures | 17 mins |
| HTML and foundation | 11 lectures | 17 mins |
| Some title goes here | Preview | 01:42 |
| Welcome guide document | 10 Pages | |
| Some title goes here | 07:42 | |
| 2 Some title goes here | 07:42 | |
| Hello Some title goes here | 07:42 | |
| This is Some title goes here | 07:42 |
| CSS and foundation | 17 lectures | 87 mins |
| Some title goes here | Preview | 01:42 |
| Welcome guide document | 10 Pages | |
| Some title goes here | 07:42 | |
| 2 Some title goes here | 07:42 | |
| Hello Some title goes here | 07:42 | |
| This is Some title goes here | 07:42 |
| Making Responsive Website | 17 lectures | 87 mins |
| Some title goes here | Preview | 01:42 |
| Welcome guide document | 10 Pages | |
| Some title goes here | 07:42 | |
| 2 Some title goes here | 07:42 | |
| Hello Some title goes here | 07:42 | |
| This is Some title goes here | 07:42 |
| Learn Sass less Scss | 17 lectures | 87 mins |
| Some title goes here | Preview | 01:42 |
| Welcome guide document | 10 Pages | |
| Some title goes here | 07:42 | |
| 2 Some title goes here | 07:42 | |
| Hello Some title goes here | 07:42 | |
| This is Some title goes here | 07:42 |
| Learn about Cpanel and file uploads | 17 lectures | 87 mins |
| Some title goes here | Preview | 01:42 |
| Welcome guide document | 10 Pages | |
| Some title goes here | 07:42 | |
| 2 Some title goes here | 07:42 | |
| Hello Some title goes here | 07:42 | |
| This is Some title goes here | 07:42 |
Enroll in this course now and avail all the benefits.

Learn One-to-One Live Course - Coming Soon.

Brainmeasures certified Professionals work with global leaders.


The video online course is well-structured and comprehensive.
The topics are organized in proper sequence to enable the candidate understand them easily.
Easy to understand and implement in real life.
Sufficient pictures, tables, graphs have been provided to make this online Course more attractive to the readers.
Final certification exam conducted under surveillance of trained human proctor.
We will ship your hard copy anywhere you ask for.


869276 Enrolled 02:11 Total Hours
$19.99
1504546 Enrolled 04:49 Total Hours
$19.99
2548421 Enrolled 02:40 Total Hours
$19.99
147977 Enrolled 00:46 Total Hours
$19.99
Take free practice test now
In today’s corporate world, a single wrong decision can cost you millions; so you cannot afford to ignore any indemnities you may incur from a single wrong hiring decision. Hiring mistakes include the cost of termination, replacement, time and productivity loss while new employees settle into their new job.
Our Mission is simply to help you attain Course Name knowledge which is at par with best, we want to help you understand Course Name tools so that you can use them when you have to carry a Course Name project and make Course Name simple and learnable.

Every month, more than 1,000 companies approach us to hire new employees, and we create customised tests (MCQs, Subjective type, one word, coding questions, Hackathon) for their drive. This proves employers' trust in our skill testing services, so having a Brainmeasures skill certificate on your resume will provide the edge you need.
We have followed up with every candidate of Brainmeasures who has taken a Brainmeasures Certificate for promotion or job and 97.78% confirmed that Brainmeasures Certificate helped them land their dream job.
Having a Brainmeasures certificate gives you an added advantage, skill is the biggest asset recruiters are looking for and what better way to prove that you are skilled than having a Brainmeasures certificate on your resume.
Brainmeasures exams are proctored which means candidates are monitored during the exam and this system has been designed to avoid any stance of cheating, while the candidate takes the test his video is recorded and the same can be provided to the employer or hiring manager if required and the certificate can be verified on-site using transcript number given on certificate.
Brainmeasures tests are developed by professionals with years of working experience which means only candidates with real skills pass the exam.
HR and Hiring Managers of leading organizations across the globe choose Brainmeasures certified professionals as we have proved in the last 13 years that when it comes to skill-testing no one does it better than Brainmeasures.
Brainmeasures.
Global leader in online certification and employment testing
info@brainmeasures.com Enquiry@brainmeasures.com