THIS CERTIFICATION IS AUTHENTIC AND ACCEPTED BY EMPLOYERS. HOW ? Read more
What You get
with this Course
DATA VISUALIZATION COURSE I CERTIFICATION I TRAINING

WHY IS THIS VIDEO TRAINING ONLINE CERTIFICATION HIGH IN DEMAND?
What will you learn from this course?
Learn the fundamental methodology and applications of data mining as well as its broad ideas. Focus on pattern discovery, a branch of data mining. Learn the principles, techniques, and data mining applications of pattern discovery in detail.
Examine several intriguing applications of pattern discovery as well as techniques for pattern-based categorization.
Explore strategies for mining different types of patterns, sequential patterns, and sub-graph patterns in this course, as well as practice and engage in scalable pattern discovery methods on vast transactional data.
Examine pattern evaluation measures.
What is data visualization?
The graphic depiction of data and information is the focus of the interdisciplinary topic of data and information visualization. When interacting with large amounts of data or information, such as a time series, it is especially effective.
In order to improve human cognition, visual representations of abstract data are also being studied. Both numerical and non-numerical data, such as text and geographic data, are included in the abstract data. It has to do with scientific visualization and infographics. One difference is that when the spatial representation is chosen, it is information visualization, and when the spatial representation is provided, it is scientific visualization.
Data visualization is the process of putting information into a visual context, such as a map or graph, so that the human brain can more easily grasp it and draw conclusions from it. Data visualization's primary objective is to make it simpler to spot patterns, trends, and outliers in big data sets. The terms information graphics, information visualization, and statistical graphics are frequently used interchangeably.
Data visualization is one of the processes in the data science process, according to which data must be represented after it has been gathered, processed, and modeled in order to draw conclusions. A component of the larger field of data presentation architecture, which tries to locate, locate, modify, prepare, and convey data in the most effective manner possible, is data visualization.
Why data visualization is important?
Data visualization is significant because it makes data easier to see, interact with, and comprehend. No of their degree of skill, the correct visualization can put everyone on the same page, whether it is straightforward or complex.
It's challenging to imagine a professional sector that will not gain from better data comprehension. Understanding data is beneficial for all STEM areas, as well as for those in the public sector, business, marketing, history, consumer goods, services, sports, and so on. Using visual data, data visualization offers a rapid and efficient approach to conveying information to all audiences. Additionally, the practice can assist businesses in determining the variables that influence consumer behavior, identifying areas that require improvement or additional attention, making data more memorable for stakeholders, figuring out the best times and locations to sell particular products, and forecasting sales volumes.
Information is easier for people to understand when it is visualized. When used in a corporate setting, visualization enables decision-makers to act more quickly than they would be able to if the data were given as reports. With the help of widgets, decision-makers may engage with the data and identify the queries that would help them gain deeper insights. Some use cases that highlight the significance of data visualization include the following:
Assisting decision-makers in comprehending how business data is evaluated in order to make business decisions
Focusing on business insights to help the target audience identify areas that need attention.
Utilizing big data sets in a visual style to summarize hidden trends, provide insights, and reveal the narrative underlying the data in order to build a business objective.
Making sense of your information can help you visualize business data to manage growth and turn trends into business plans.
Highlighting crucial, previously overlooked aspects of the data sources to assist in the creation of data analysis reports for decision-makers.
What are the benefits of data visualization?
More appealing and user-friendly
The use of visually appealing methods of data presentation and adherence to design best practices help to create this attractiveness. By utilizing the most suitable chart and style options, next-level visualizations convey data in a very logical manner. Additionally, graceful transitions make it possible to move between various points in a visualization's narrative in an appealing and fluid manner. As a result, a user will be more engaged with the picture, making interpretation and understanding simple and rapid. As a result, the audience deeply connects with the message.
Determine patterns
Other previously hidden patterns are revealed via data visualization. These additional emergent characteristics in the data can create novel, useful insights that were previously unknown. Business users can see links and trends in the data through visualization, which also provides the data with more significance. Users can assess the importance of these areas to advance their business by focusing on the specific regions in the data that require attention by analyzing these patterns.
Simple to comprehend
By transforming the data into a format that is simple for everyone to grasp, the goal is to effectively tell a story. The noise in the data would eventually be reduced as relevant information was highlighted.
Expected Salary
PayScale estimates that a data scientist with data visualization abilities may earn between $58,000 and $122,000 per year, with an average income of $93,747.
Why Brainmeasures?
Brainmeasures is an ISO-certified company that offers you high-end certification courses and many other services to boost your career. We hire experienced and qualified experts to create in-depth and prominent content courses to train our learners whether they are amateurs or have some experience in the field. We provide the best courses to offer you top-notch skills with a broad scope.
At Brainmeasures, you will be provided high-end courses after which you can get a hard copy certificate. You only have to clear a test and you will get a certificate that assures you a bright future by securing your job. You will be hired by great companies in no time.
There are also many other facilities and features provided by Brainmeasures.
1300 eBook Courses (Technical and Non-Technical)
20000+ Video Courses (Technical and Non-Technical)
Reviews (If you like our services let others know)
Course Syllabus
| Getting Started | 11 lectures | 17 mins |
| HTML and foundation | 11 lectures | 17 mins |
| Some title goes here | Preview | 01:42 |
| Welcome guide document | 10 Pages | |
| Some title goes here | 07:42 | |
| 2 Some title goes here | 07:42 | |
| Hello Some title goes here | 07:42 | |
| This is Some title goes here | 07:42 |
| CSS and foundation | 17 lectures | 87 mins |
| Some title goes here | Preview | 01:42 |
| Welcome guide document | 10 Pages | |
| Some title goes here | 07:42 | |
| 2 Some title goes here | 07:42 | |
| Hello Some title goes here | 07:42 | |
| This is Some title goes here | 07:42 |
| Making Responsive Website | 17 lectures | 87 mins |
| Some title goes here | Preview | 01:42 |
| Welcome guide document | 10 Pages | |
| Some title goes here | 07:42 | |
| 2 Some title goes here | 07:42 | |
| Hello Some title goes here | 07:42 | |
| This is Some title goes here | 07:42 |
| Learn Sass less Scss | 17 lectures | 87 mins |
| Some title goes here | Preview | 01:42 |
| Welcome guide document | 10 Pages | |
| Some title goes here | 07:42 | |
| 2 Some title goes here | 07:42 | |
| Hello Some title goes here | 07:42 | |
| This is Some title goes here | 07:42 |
| Learn about Cpanel and file uploads | 17 lectures | 87 mins |
| Some title goes here | Preview | 01:42 |
| Welcome guide document | 10 Pages | |
| Some title goes here | 07:42 | |
| 2 Some title goes here | 07:42 | |
| Hello Some title goes here | 07:42 | |
| This is Some title goes here | 07:42 |
Do you want this course
to learn
LIVE
?
Enroll in this course now and avail all the benefits.

Learn from industry
Experts
LIVE
?
Learn One-to-One Live Course - Coming Soon.


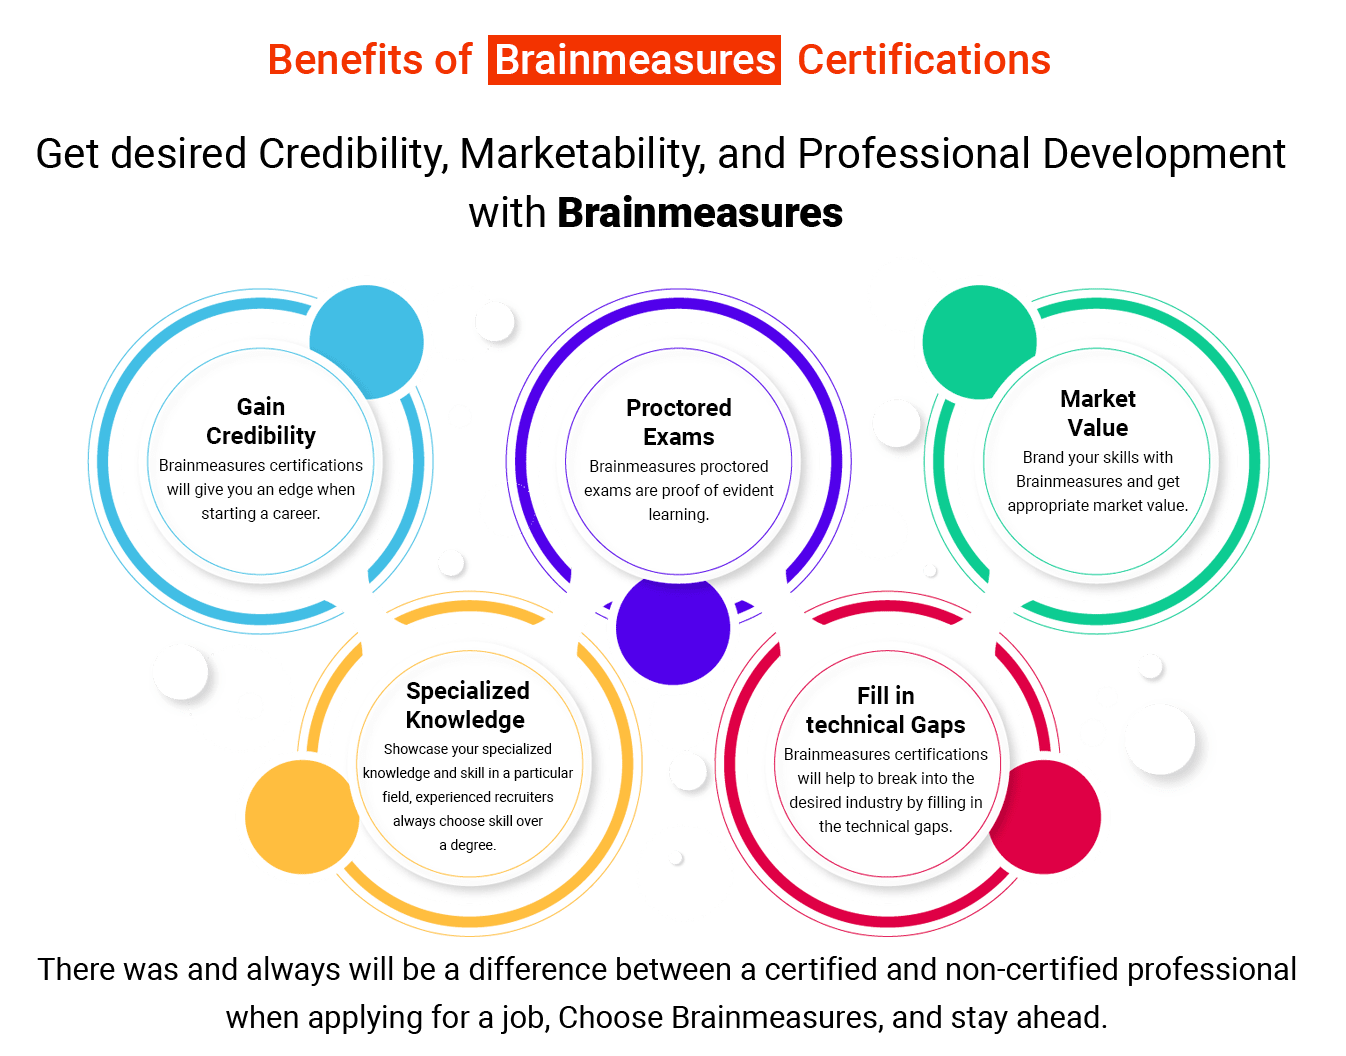
Brainmeasures Certifications are acknowledged globally because the tests are conducted under the strict vigilance of trained proctors and are recorded which makes Brainmeausres testing system the most authentic testing platform.
Enroll NowOur Hiring Partners
Brainmeasures certified Professionals work with global leaders.

Corporate Training
If you want to give the Trending technology experience to your esteemed employees, we are here to help you!
CONTACT CORPORATE CO-ORDINATOR
What makes DATA VISUALIZATION COURSE I CERTIFICATION I TRAININGunique?
VIDEO ONLINE COURSE
The video online course is well-structured and comprehensive.
EASY TO UNDERSTAND
The topics are organized in proper sequence to enable the candidate understand them easily.
SELF-EXPLANATORY
Easy to understand and implement in real life.
MORE ATTRACTIVE
Sufficient pictures, tables, graphs have been provided to make this online Course more attractive to the readers.
PROCTOR SURVELIANCE
Final certification exam conducted under surveillance of trained human proctor.
HARD COPY SHIPPED
We will ship your hard copy anywhere you ask for.
-

- We will ship your hard copy anywhere you ask for.
- SAMPLE HARDCOPY CETIFICATE
-

- Immediately after taking the test you can check your scores with detailed.
- Immediately download soft copy certificate.
- VIEW ANALYSIS REPORT
-

- ENROLL FOR DATA VISUALIZATION COURSE I CERTIFICATION I TRAINING - VIDEO COURSE AND CERTIFICATION PROGRAM
- REGISTER NOW
-

- Online Video course by Highly qualified Trainers.
-

- If you have any query our trainers are accessible easily.
- Send your questions and get answers within 7 working days.
-

- Final exam is proctored – you will be monitored throughout, this is done using our high-end Proctor software, so that you need not go to any special location but take it from your own PC.
- This testing format matches world-class testing standards.
- Certificate will mention wording proctored to prove the authenticity of your knowledge.
-

- You can take any number of retakes if you are not satisfied with your score or failed to pass.
- Test re-takes are paid, each retake is worth $ 50.
-

- Earn high.
- Brainmeasures certificates are honoured by employees worldwide.
- Get desired position in your organization.
TAKE A FREE TEST
DATA VISUALIZATION COURSE I CERTIFICATION I TRAINING
Take free practice test now
Reviews ( click here to Read all )
Why choose Us
In today’s corporate world, a single wrong decision can cost you millions; so you cannot afford to ignore any indemnities you may incur from a single wrong hiring decision. Hiring mistakes include the cost of termination, replacement, time and productivity loss while new employees settle into their new job.
Our Mission
Our Mission is simply to help you attain Course Name knowledge which is at par with best, we want to help you understand Course Name tools so that you can use them when you have to carry a Course Name project and make Course Name simple and learnable.


