THIS CERTIFICATION IS AUTHENTIC AND ACCEPTED BY EMPLOYERS. HOW ? Read more
What You get
with this Course
Tableau 10 Course

WHY IS THIS VIDEO TRAINING ONLINE CERTIFICATION HIGH IN DEMAND?
What is Tableau 10?
Tableau 10 is a Business Intelligence tool developed by Tableau Software is an American Interactive Data Visualization Software Company.
In simple terms, “Tableau is trending and market-leading BI tool used to visualize and analyze your data in an easily digestible format. It allows you to work on live data-set and spend more time on data analysis rather than data wrangling.”
Is Tableau hard to learn and use?
Tableau is easy to use tool and great for end-users who don’t have much technical know-how. Another benefit of the tableau is it can multiple data connections this means Tableau easily connects to any data source, be it corporate Data Warehouse, Microsoft Excel, or web-based data.
Tableau can be used to connect to different data sources from files and servers, file formats like CSV, JSON, TXT, or even get your data imported from servers.
This makes tableau a great choice for data visualization and Business Intelligence.
Tableau is a very powerful business intelligence tool used by big companies like Amazon, Walmart, Linked In, CISCO for analyzing data.
Why Tableau is so popular?
1 Tableau software is used to translate queries into visualization.
2 Managing metadata
3 Imports data of all sizes and ranges.
4 For a non-technical user, a Tableau is a great tool as it offers the facility to create ‘no-code’ data queries.
Types of Tableau Tools
Developer Tools – used to create worksheets, desktop, visualizations.
Sharing Tools – These tools are used to share information created by developer tools with the audience.
Features of Tableau
Real-time analysis
Data blending
Collaboration of data
Allowing to work on without technical knowledge
Brainmeasures Tableau 10 Video course is a comprehensive online video course on tableau developed by experts to give working tableau knowledge to candidates. Brainmeasures video courses have been developed by experts, and this course has been curated in a way to take the user from basic to advanced level.
Brainmeasures tableau course has been developed to help candidates to visualize data and quickly analyze data in form of dashboards and worksheets, which helps to gain actionable insights and drive the business forward.
Topics Covered
- Groups and Sets
- Fundaments of groups
- Creating sets
- Controlling sets
- Comprehensive knowledge of Tables
- Advanced-Data Prep
- Animations
- Visualizations
Related Skills and Courses
Brainmeasures learning platform is an ideal platform for working professionals or for enthusiasts and self-learners who want to enhance their skills, if you are enrolling for the tableau 10 courses, you must create your power combo and enhance the skills.
Analytics and Business Intelligence Course
Data Science and Business Analysis Course
Brainmeasures courses are self-paced courses and culminate in a certification exam, on passing the exam you will be a certified professional.
Check the links below
3000 Ebooks Courses (Technical and Non-Technical)
2500+ Video Courses (Technical and Non-Technical)
Reviews (If you like our services let others know)
Course Syllabus
| Getting Started | 11 lectures | 17 mins |
| HTML and foundation | 11 lectures | 17 mins |
| Some title goes here | Preview | 01:42 |
| Welcome guide document | 10 Pages | |
| Some title goes here | 07:42 | |
| 2 Some title goes here | 07:42 | |
| Hello Some title goes here | 07:42 | |
| This is Some title goes here | 07:42 |
| CSS and foundation | 17 lectures | 87 mins |
| Some title goes here | Preview | 01:42 |
| Welcome guide document | 10 Pages | |
| Some title goes here | 07:42 | |
| 2 Some title goes here | 07:42 | |
| Hello Some title goes here | 07:42 | |
| This is Some title goes here | 07:42 |
| Making Responsive Website | 17 lectures | 87 mins |
| Some title goes here | Preview | 01:42 |
| Welcome guide document | 10 Pages | |
| Some title goes here | 07:42 | |
| 2 Some title goes here | 07:42 | |
| Hello Some title goes here | 07:42 | |
| This is Some title goes here | 07:42 |
| Learn Sass less Scss | 17 lectures | 87 mins |
| Some title goes here | Preview | 01:42 |
| Welcome guide document | 10 Pages | |
| Some title goes here | 07:42 | |
| 2 Some title goes here | 07:42 | |
| Hello Some title goes here | 07:42 | |
| This is Some title goes here | 07:42 |
| Learn about Cpanel and file uploads | 17 lectures | 87 mins |
| Some title goes here | Preview | 01:42 |
| Welcome guide document | 10 Pages | |
| Some title goes here | 07:42 | |
| 2 Some title goes here | 07:42 | |
| Hello Some title goes here | 07:42 | |
| This is Some title goes here | 07:42 |
Do you want this course
to learn
LIVE
?
Enroll in this course now and avail all the benefits.

Learn from industry
Experts
LIVE
?
Learn One-to-One Live Course - Coming Soon.
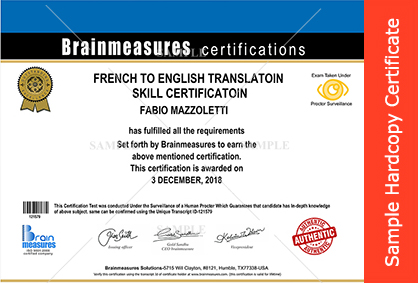


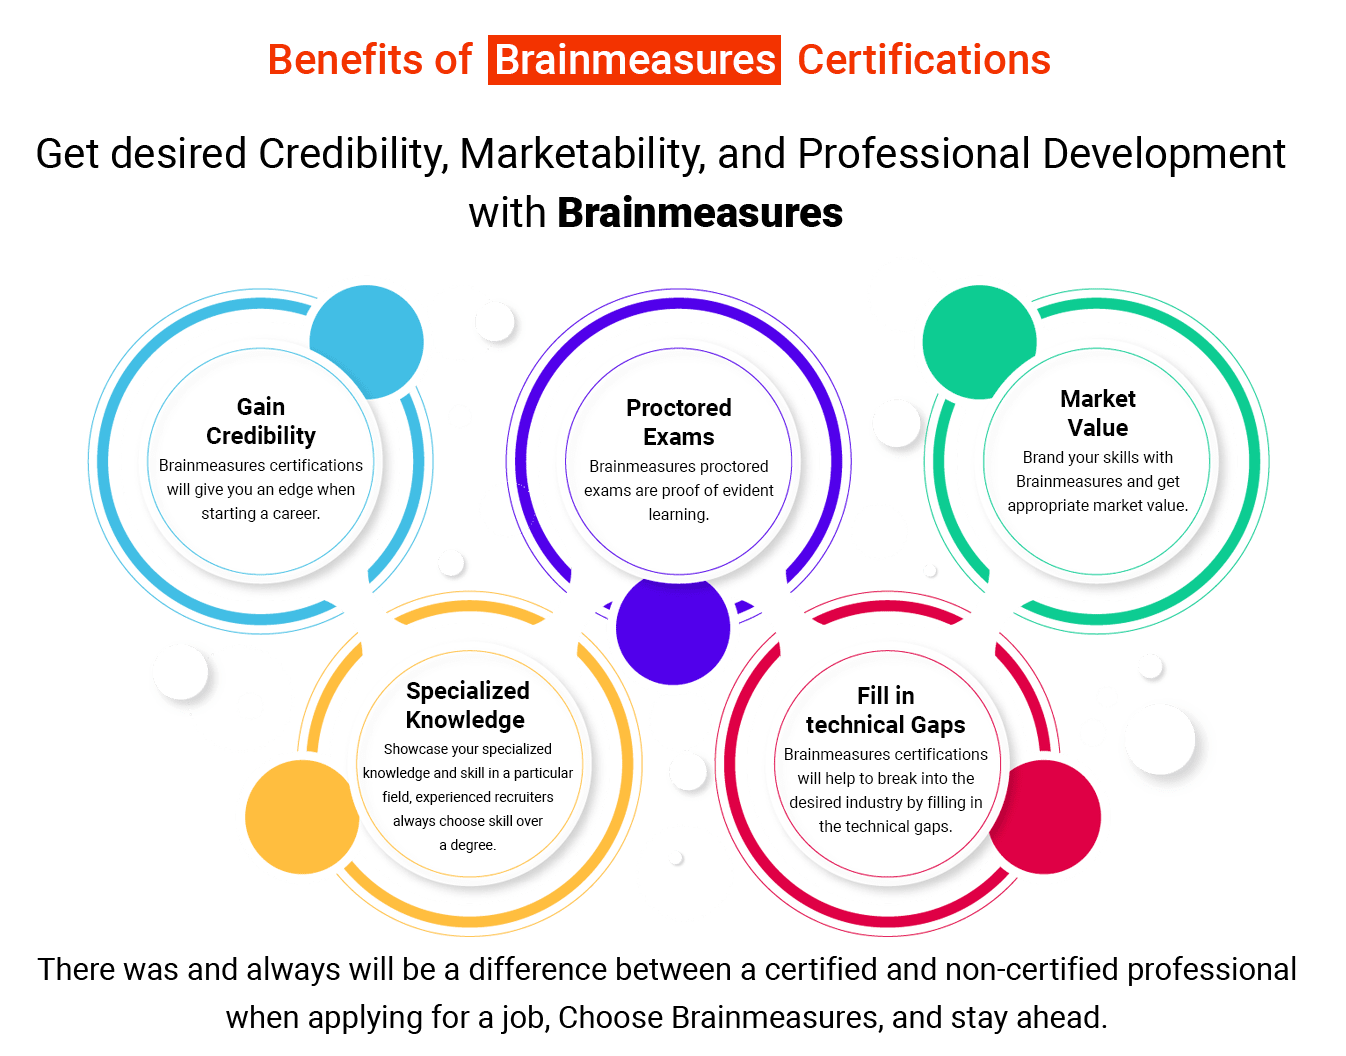
Brainmeasures Certifications are acknowledged globally because the tests are conducted under the strict vigilance of trained proctors and are recorded which makes Brainmeausres testing system the most authentic testing platform.
Enroll NowOur Hiring Partners
Brainmeasures certified Professionals work with global leaders.

Corporate Training
If you want to give the Trending technology experience to your esteemed employees, we are here to help you!
CONTACT CORPORATE CO-ORDINATOR
What makes Tableau 10 Courseunique?
VIDEO ONLINE COURSE
The video online course is well-structured and comprehensive.
EASY TO UNDERSTAND
The topics are organized in proper sequence to enable the candidate understand them easily.
SELF-EXPLANATORY
Easy to understand and implement in real life.
MORE ATTRACTIVE
Sufficient pictures, tables, graphs have been provided to make this online Course more attractive to the readers.
PROCTOR SURVELIANCE
Final certification exam conducted under surveillance of trained human proctor.
HARD COPY SHIPPED
We will ship your hard copy anywhere you ask for.
-

- We will ship your hard copy anywhere you ask for.
- SAMPLE HARDCOPY CETIFICATE
-

- Immediately after taking the test you can check your scores with detailed.
- Immediately download soft copy certificate.
- VIEW ANALYSIS REPORT
-

- ENROLL FOR Tableau 10 Course - VIDEO COURSE AND CERTIFICATION PROGRAM
- REGISTER NOW
-

- Online Video course by Highly qualified Trainers.
-

- If you have any query our trainers are accessible easily.
- Send your questions and get answers within 7 working days.
-

- Final exam is proctored – you will be monitored throughout, this is done using our high-end Proctor software, so that you need not go to any special location but take it from your own PC.
- This testing format matches world-class testing standards.
- Certificate will mention wording proctored to prove the authenticity of your knowledge.
-

- You can take any number of retakes if you are not satisfied with your score or failed to pass.
- Test re-takes are paid, each retake is worth $ 50.
-

- Earn high.
- Brainmeasures certificates are honoured by employees worldwide.
- Get desired position in your organization.
TAKE A FREE TEST
Tableau 10 Course
Take free practice test now
Reviews ( click here to Read all )
Why choose Us
In today’s corporate world, a single wrong decision can cost you millions; so you cannot afford to ignore any indemnities you may incur from a single wrong hiring decision. Hiring mistakes include the cost of termination, replacement, time and productivity loss while new employees settle into their new job.
Our Mission
Our Mission is simply to help you attain Course Name knowledge which is at par with best, we want to help you understand Course Name tools so that you can use them when you have to carry a Course Name project and make Course Name simple and learnable.


